As election season heats up, we are often presented with questions regarding market returns based on the political party composition of the White House and Congress. In our Election Preview Weekly Market Commentary, we took a closer look at equity returns under various political scenarios. Here we provide the data for the other side of a standard asset allocation by investigating bond returns under various congressional makeups.
Using the 10-year Treasury bond as a proxy, we pulled the data going back to 1951, as the major bond indices do not have as long of a track record. While equity markets encounter greater volatility from corporate earnings, Treasury markets are largely driven by changes in interest rates. As shown in the LPL Chart of the Day, there does not appear to be as clear of a relationship between congressional makeup and Treasury returns as we saw for equity markets:
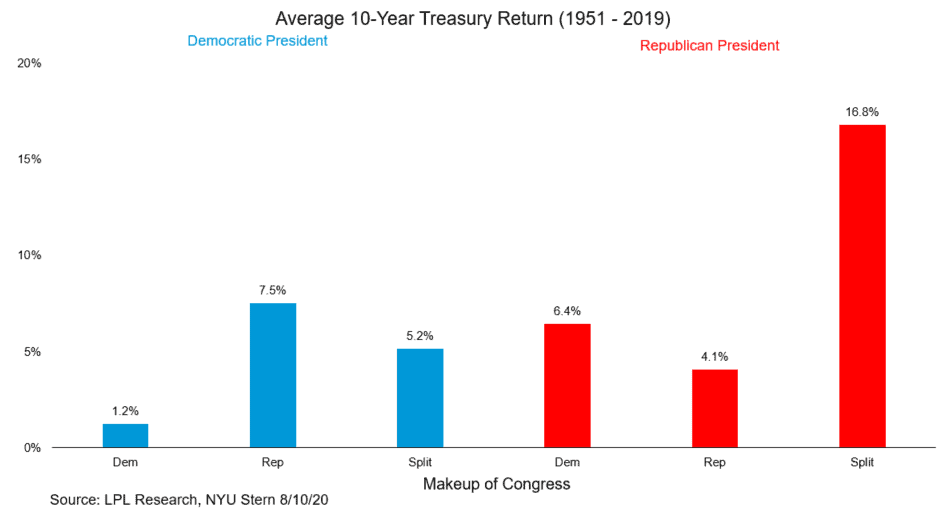
While returns for the 10-year Treasury under a Republican president and a split Congress appear to be much better than other combinations, it is important to remember that Treasury yields reached their all-time peak at nearly 16% just before the beginning of Ronald Reagan’s first term. The yield on the 10-year eventually fell around 7% by the end of his second term, causing the returns under his administration to greatly skew the data.
With the 10-year Treasury yield currently trading just above 0.6%, it would seem unlikely that Treasury yields will ever return to the levels seen in the 1980s. However, despite low yields, 2020 has shown that the “safe haven” appeal of Treasuries can play an important role in client portfolios to limit volatility.
IMPORTANT DISCLOSURES
This material is for general information only and is not intended to provide specific advice or recommendations for any individual. There is no assurance that the views or strategies discussed are suitable for all investors or will yield positive outcomes. Investing involves risks including possible loss of principal. Any economic forecasts set forth may not develop as predicted and are subject to change.
References to markets, asset classes, and sectors are generally regarding the corresponding market index. Indexes are unmanaged statistical composites and cannot be invested into directly. Index performance is not indicative of the performance of any investment and do not reflect fees, expenses, or sales charges. All performance referenced is historical and is no guarantee of future results.
Any company names noted herein are for educational purposes only and not an indication of trading intent or a solicitation of their products or services. LPL Financial doesn’t provide research on individual equities. All information is believed to be from reliable sources; however, LPL Financial makes no representation as to its completeness or accuracy.
All index and market data from FactSet and MarketWatch.
This Research material was prepared by LPL Financial, LLC.
Securities and advisory services offered through LPL Financial (LPL), a registered investment advisor and broker-dealer (member FINRA/SIPC).
Insurance products are offered through LPL or its licensed affiliates. To the extent you are receiving investment advice from a separately registered independent investment advisor that is not an LPL affiliate, please note LPL makes no representation with respect to such entity.
- Not Insured by FDIC/NCUA or Any Other Government Agency
- Not Bank/Credit Union Guaranteed
- Not Bank/Credit Union Deposits or Obligations
- May Lose Value
For Public Use – Tracking 1-05043035